Market Outlook
February 07, 2018
Market Cues
Domestic Indices
Chg (%)
(Pts)
(Close)
Indian markets are likely to open positive tracking global indices and SGX Nifty.
BSE Sensex
(1.6)
(561)
34,196
US stocks remain volatile over the course of the trading session before ending the
Nifty
(1.6)
(168)
10,498
day firmly in positive territory. The Dow Jones ended on upside front of 2.3% to
Mid Cap
(1.7)
(278)
16,281
close at 24,913 and the Nasdaq Composite edged up to 2.1%, to 7,116.
Small Cap
(2.2)
(390)
17,392
Bankex
(1.3)
(380)
29,197
U.K. shares fell sharply as a global market rout intensified and the second phase of
Brexit talks kicked off in London with the EU Chief Negotiator Michel Barnier
repeating his call for more ‘clarity' from the U.K. on its position. The FTSE 100 was
Global Indices
Chg (%)
(Pts)
(Close)
down by 2.6% to close at 7,141.
Dow Jones
2.3
567
24,913
Nasdaq
2.1
148
7,116
On domestic front, Indian shares opened sharply lower to extend their recent sell off
as growing concerns over fiscal slippages and the return of the long term capital
FTSE
(2.6)
(194)
7,141
gains tax on equities in this budget continued to haunt investors ahead of the RBI
Nikkei
3.1
660
22,271
policy. The Sensex ended on a downside front of 1.6% at 34,196 while the Nifty
Hang Seng
1.9
568
31,163
ended at 10,498 with a downside of 1.6%.
Shanghai Com
1.0
35
3,405
News Analysis
Advances / Declines
BSE
NSE
RBI likely to keep policy rates on hold
Advances
513
303
Detailed analysis on Pg2
Declines
2,271
1,540
Investor’s Ready Reckoner
Unchanged
143
38
Key Domestic & Global Indicators
Stock Watch: Latest investment recommendations on 150+ stocks
Volumes (` Cr)
Refer Pg5 onwards
BSE
5,349
NSE
39,339
Top Picks
CMP
Target
Upside
Company
Sector
Rating
(`)
(`)
(%)
Net Inflows (` Cr)
Net
Mtd
Ytd
Blue Star
Capital Goods
Buy
722
867
20.1
FII
(1,083)
1,372
14,356
Dewan Housing Finance
Financials
Buy
506
712
40.8
Asian Granito
Other
Buy
492
651
32.3
*MFs
(957)
(1,222)
6,165
Navkar Corporation
Other
Buy
168
265
57.8
KEI Industries
Capital Goods
Buy
352
436
23.9
Top Gainers
Price (`)
Chg (%)
More Top Picks on Pg4
Religare
43
5.0
Key Upcoming Events
Advenzymes
257
4.0
Previous
Consensus
Date
Region
Event Description
Vipind
351
3.9
Reading
Expectations
Bomdyeing
231
3.8
Feb07
India
RBI Reverse Repo rate
5.75
5.75
Feb07
India
RBI Cash Reserve ratio
4.00
4.00
Oil
349
3.7
Feb07
India
RBI Repo rate
6.00
6.00
Feb08
US
Initial Jobless claims
230.00
233.00
Top Losers
Price (`)
Chg (%)
Feb08
UK
Industrial Production (YoY)
2.50
0.30
More Events on Pg7
Vakrangee
213
(10.0)
Dbl
812
(8.2)
Pcjeweller
392
(7.5)
Ifci
23
(7.3)
Jpassociat
18
(7.1)
As on February 06 2018
Market Outlook
February 07, 2018
News Analysis
RBI likely to keep policy rates on hold
In the Reserve Bank of India's (RBI) Monetary Policy Committee (MPC) meeting,
which will be held in Mumbai, the apex bank is expected to keep policy rates on
hold for this week.
However, the bank may toughen its warning against inflation, lying on the ground
for a hike in 2018 after prices accelerated at the fastest pace in the last 17
months. The bank is also worried about high global crude prices.
Though RBI has held the rates steady since a 25 basis point cut in August 2017,
the prospects of rate hike have increased, as annual inflation accelerated to 5.21
percent in December 2017.
Economic and Political News
Decline in stock indices due to global market meltdown, not LTCG tax
Taxpayers' base is 80mn, no taxman can pick up a case on discretion
Centre sees its GST compensation to states at Rs 900 billion for FY19
RBI likely to keep policy rates on hold due to high inflation risks
Corporate News
Ashok Leyland to invest Rs 1 billion in electric vehicle technology
Airtel offers 2x data, add-on SIM with unlimited calls with postpaid plans
ICICI Securities gets Sebi's go-ahead for IPO to raise Rs 30bn-Rs 40bn
Israel to give 750,000euros to AI for launching Delhi-Tel Aviv flight
Market Outlook
February 07, 2018
Quarterly Bloomberg Brokers Consensus Estimate
Cipla Ltd - Feb 07, 2018
Particulars ( ` cr)
3QFY18E
3QFY17
y-o-y (%)
2QFY18
q-o-q (%)
Sales
4,115
3,647
12.8
4,082
0.8
EBIDTA
835
677
23.4
804
3.8
%
20.3
18.5
19.7
PAT
460
374
22.9
434
5.9
Aurobindo Pharma Ltd. - Feb 07, 2018
Particulars ( ` cr)
3QFY18E
3QFY17
y-o-y (%)
2QFY18
q-o-q (%)
Sales
4,255
2,521
68.7
3,073
38.4
EBIDTA
1,012
634
59.6
1,039
(2.6)
%
23.8
25.2
33.8
PAT
663
441
50.3
752
(11.8)
Eicher Motors Ltd. - Feb 07, 2018
Particulars ( ` cr)
3QFY18E
3QFY17
y-o-y (%)
2QFY18
q-o-q (%)
Sales
2,221
1,834
21.1
2,167
2.5
EBIDTA
704
577
22.1
682
3.2
%
31.7
31.5
31.5
PAT
538
418
28.7
518
3.8
Market Outlook
February 07, 2018
Top Picks
Market Cap
CMP
Target
Upside
Company
Rationale
(` Cr)
(`)
(`)
(%)
Strong growth in domestic business due to its leade`hip
in acute therapeutic segment. Alkem expects to launch
Alkem Laboratories
25,910
2,167
2,441
12.6
more products in USA, which bodes for its international
business.
We expect the company would report strong profitability
Asian Granito
1,481
492
651
32.3
owing to better product mix, higher B2C sales and
amalgamation synergy.
Favorable outlook for the AC industry to augur well for
Cooling products business which is out pacing the
Blue Star
6,926
722
867
20.1
market growth. EMPPAC division's profitability to
improve once operating environment turns around.
With a focus on the low and medium income (LMI)
consumer segment, the company has increased its
Dewan Housing Finance
15,857
506
712
40.8
presence in tier-II & III cities where the growth
opportunity is immense.
Loan growth is likely to pick up after a sluggish FY17.
Lower credit cost will help in strong bottom-line growth.
Karur Vysya Bank
8,024
110
160
44.9
Increasing share of CASA will help in NIM
improvement.
High order book execution in EPC segment, rising B2C
KEI Industries
2,757
352
436
23.9
sales and higher exports to boost the revenues and
profitability
Expected to benefit from the lower capex requirement
Music Broadcast
2,009
352
475
34.9
and 15 year long radio broadcast licensing.
Massive capacity expansion along with rail advantage
Navkar Corporation
2,527
168
265
57.8
at ICD as well CFS augur well for the company
Strong brands and distribution network would boost
Siyaram Silk Mills
2,974
635
851
34.1
growth going ahead. Stock currently trades at an
inexpensive valuation.
Market leadership in Hindi news genre and no.
2
viewership ranking in English news genre, exit from the
TV Today Network
2,596
435
500
14.9
radio business, and anticipated growth in ad spends by
corporate to benefit the stock.
After GST, the company is expected to see higher
volumes along with improving product mix. The Gujarat
Maruti Suzuki
2,71,402
8,984
10,619
18.2
plant will also enable higher operating leverage which
will be margin accretive.
We expect loan book to grow at 24.3% over next two
GIC Housing
2,094
389
655
68.4
year; change in borrowing mix will help in NIM
improvement
We expect CPIL to report net Revenue/PAT CAGR of
~17%/16% over FY2017-20E mainly due to healthy
6,665
300
400
33.3
growth in plywood & lamination business, forayed into
Century Plyboards India
MDF & Particle boards on back of strong brand &
distribution network.
We expect sales/PAT to grow at 13.5%/20% over next
LT Foods
2,763
86
128
48.1
two years on the back of strong distribution network &
addition of new products in portfolio.
We expect sales/PAT to grow at 13%/16% over next two
years on the back of strong healthy demand in writing
Ruchira Papers
374
167
244
46.1
& printing paper and Kraft paper. Further, China had
banned making paper from waste pulp which would
benefit Indian paper companies.
We expect financialisation of savings and increasing
Aditya Birla Capital
36942
158
230
45.5
penetration in Insurance & Mutual fund would ensure
steady growth.
Source: Company, Angel Research
Market Outlook
February 07, 2018
Fundamental Call
Market Cap
CMP
Target
Upside
Company
Rationale
(` Cr)
(`)
(`)
(%)
CCL is likely to maintain the strong growth trajectory
CCL Products
3,884
292
360
23.3
over FY18-20 backed by capacity expansion and new
geographical foray
We forecast Nilkamal to report top-line CAGR of ~9%
to `2,635cr over FY17-20E on the back of healthy
Nilkamal
2,453
1,644
2,178
32.5
demand growth in plastic division. On the bottom-line
front, we estimate ~10% CAGR to `162cr owing to
improvement in volumes.
We expect sales/PAT to grow at 9%/14% over next two
years on the back of healthy demand growth in
Shreyans Industries
234
169
247
46.2
printing. Further, China had banned making paper
from waste pulp which would benefit Indian paper
companies.
The prism has diversified exposure in the different
segment such as Cement, Tile & ready mix concrete.
Prism Cement
6,133
122
160
31.3
Thus we believe, PCL is in the right place to capture
ongoing government spending on affordable housing
and infrastructure projects.
Source: Company, Angel Research
Market Outlook
February 07, 2018
Key Upcoming Events
Result Calendar
Date
Company
February 07, 2018
FAG Bearings, Areva, BGR Energy , Hexaware, Indraprasth Gas, Elecon Engineering, Cipla, Aurobindo Pharma
February 08, 2018
Bharat Forge, BHEL, ABB, ACC, Reliance Capital, Andhra Bank, SAIL, Petronet LNG, GSPL, Page Industries
Source: Bloomberg, Angel Research
Global economic events release calendar
Bloomberg Data
Date
Time
Country
Event Description
Unit
Period
Last Reported
Estimated
Feb 07, 2018
2:30 PMIndia
RBI Reverse Repo rate
%
Feb 7
5.75
5.75
2:30 PMIndia
RBI Cash Reserve ratio
%
Feb 7
4.00
4.00
2:30 PMIndia
RBI Repo rate
%
Feb 7
6.00
6.00
Feb 08, 2018
7:00 PMUS
Initial Jobless claims
Thousands
Feb 3
230.00
233.00
3:00 PMUK
Industrial Production (YoY)
% Change
Dec
2.50
0.30
China
Exports YoY%
% Change
Jan
10.90
10.80
Feb 09, 2018
5:30 PMUK
BOE Announces rates
% Ratio
Feb 8
0.50
0.50
7:00 AMChina
Consumer Price Index (YoY)
% Change
Jan
1.80
1.50
Feb 12, 2018
5:30 PMIndia
Industrial Production YoY
% Change
Dec
8.40
Feb 13, 2018
3:00 PMUK
CPI (YoY)
% Change
Jan
3.00
Feb 14, 2018
3:30 PMEuro Zone Euro-Zone GDP s.a. (QoQ)
% Change
4Q P
0.60
12:00 PMIndia
Monthly Wholesale Prices YoY%
% Change
Jan
3.58
7:00 PMUS
Consumer price index (mom)
% Change
Jan
0.10
0.30
12:30 PMGermany GDP nsa (YoY)
% Change
4Q P
2.30
Feb 15, 2018
7:45 PMUS
Industrial Production
%
Jan
0.89
0.30
Source: Bloomberg, Angel Research
Market Outlook
February 07, 2018
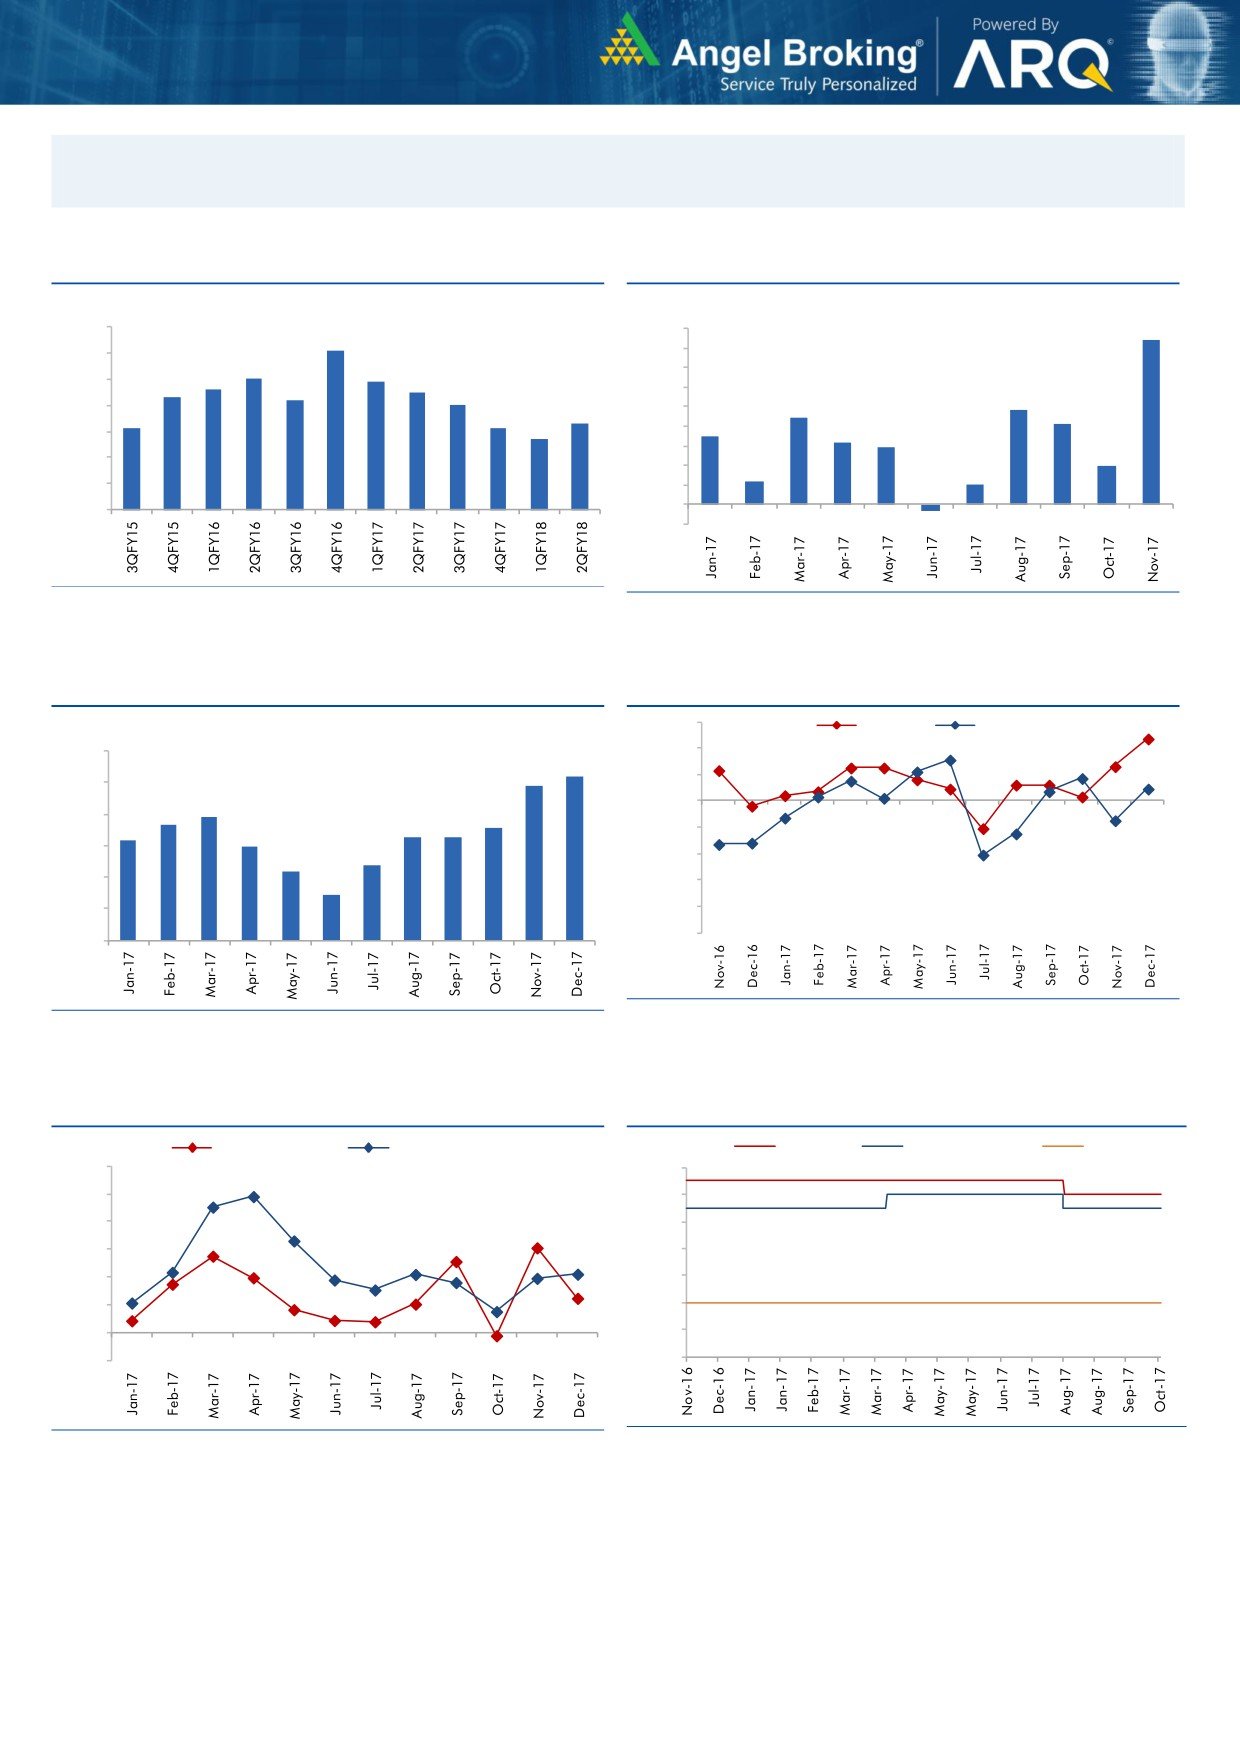
Macro watch
Exhibit 1: Quarterly GDP trends
Exhibit 2: IIP trends
(%)
(%)
10.0
9.0
8.4
9.1
9.0
8.0
8.0
7.9
7.0
7.6
7.5
8.0
7.3
7.2
7.0
6.0
4.8
7.0
6.3
5.0
4.4
4.1
6.1
6.1
5.7
3.5
3.2
6.0
4.0
2.9
3.0
2.0
5.0
2.0
1.2
1.0
4.0
1.0
-
3.0
(1.0)
(0.3)
Source: CSO, Angel Research
Source: MOSPI, Angel Research
Exhibit 3: Monthly CPI inflation trends
Exhibit 4: Manufacturing and services PMI
56.0
Mfg. PMI
Services PMI
(%)
6.0
54.0
5.2
4.9
52.0
5.0
3.9
50.0
3.7
3.6
4.0
3.3
3.3
3.2
3.0
48.0
3.0
2.4
2.2
46.0
2.0
1.5
44.0
1.0
42.0
40.0
-
Source: Market, Angel Research; Note: Level above 50 indicates expansion
Source: MOSPI, Angel Research
Exhibit 5: Exports and imports growth trends
Exhibit 6: Key policy rates
(%)
Exports yoy growth
Imports yoy growth
(%)
Repo rate
Reverse Repo rate
CRR
60.0
6.50
50.0
6.00
40.0
5.50
30.0
5.00
20.0
4.50
10.0
4.00
0.0
3.50
(10.0)
3.00
Source: Bloomberg, Angel Research
Source: RBI, Angel Research
Market Outlook
February 07, 2018
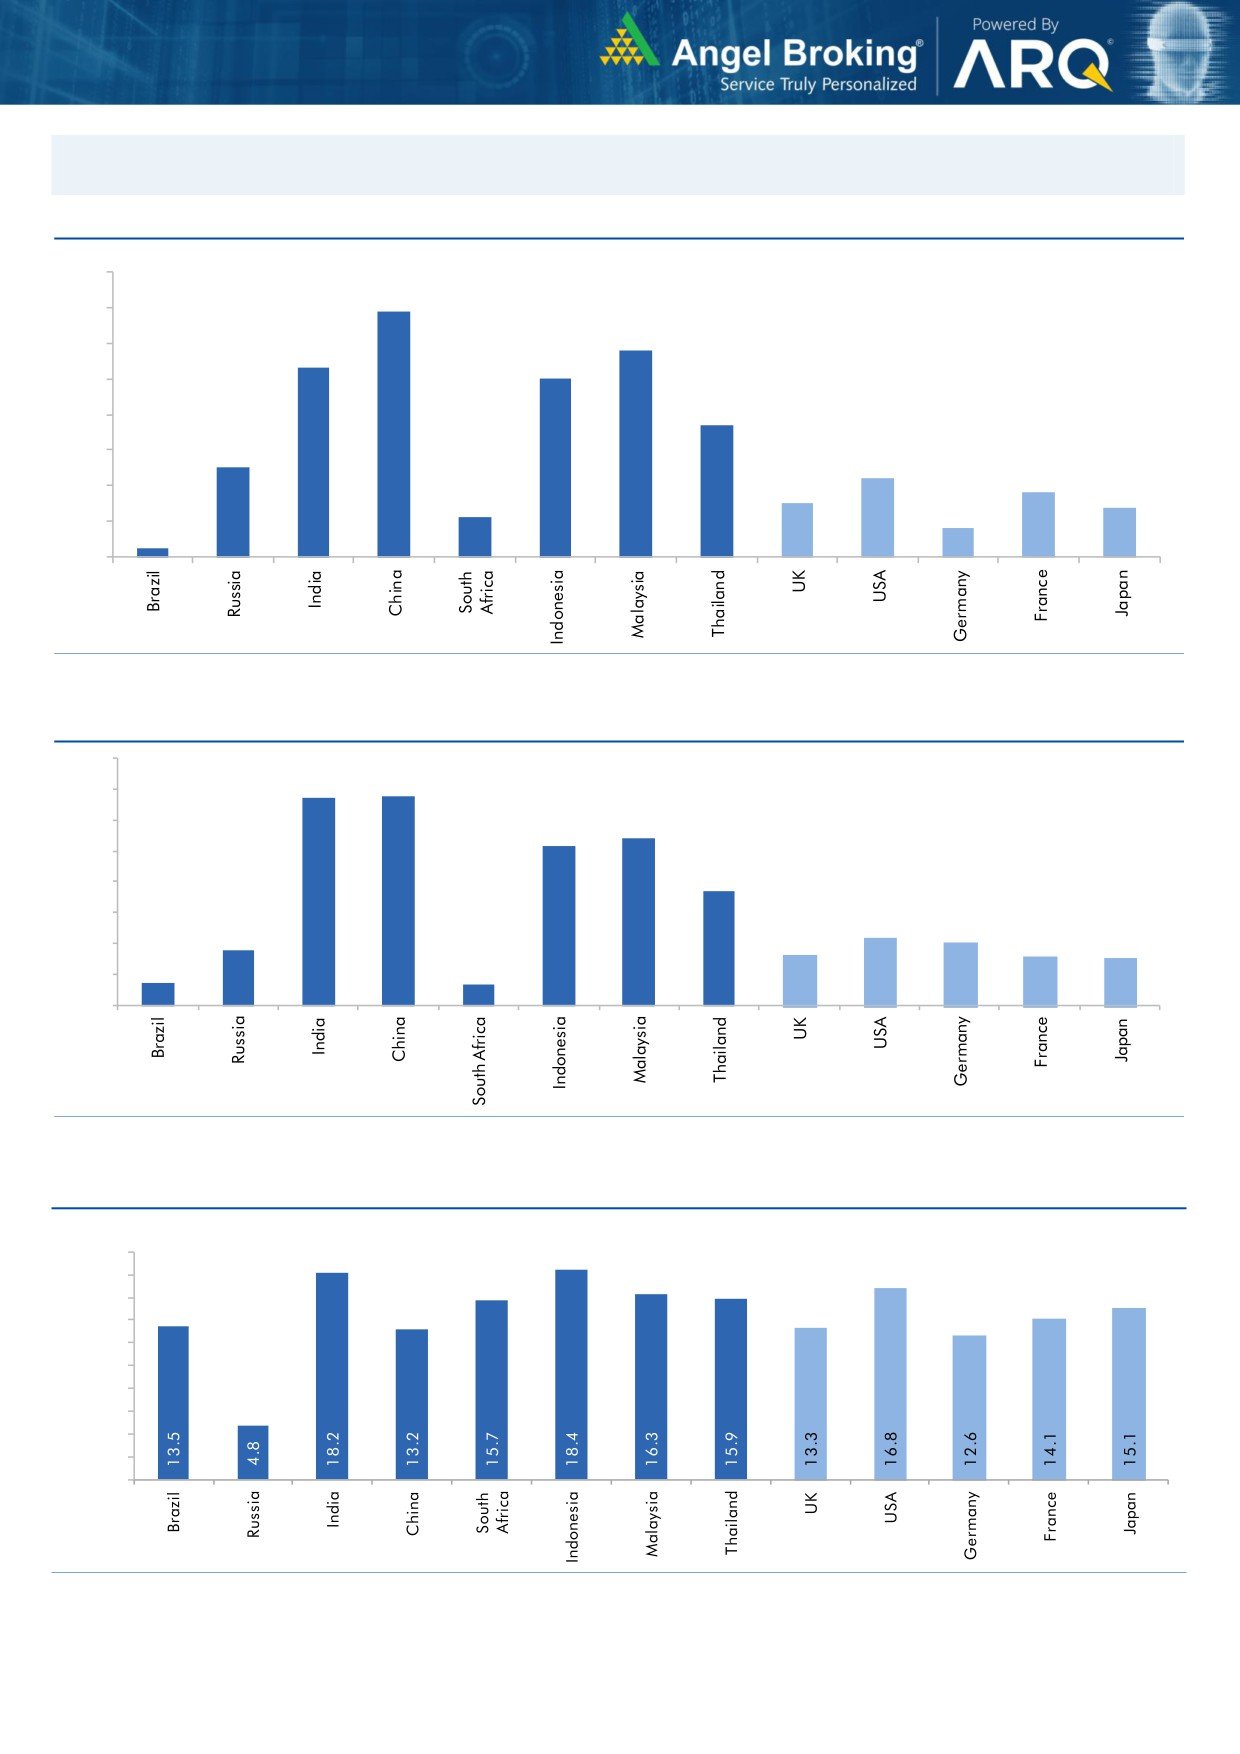
Global watch
Exhibit 1: Latest quarterly GDP Growth (%, yoy) across select developing and developed countries
(%)
8.0
6.9
7.0
5.8
6.0
5.3
5.0
5.0
1.1
3.7
4.0
2.5
3.0
2.2
1.8
2.0
1.5
1.4
0.8
1.0
0.3
-
Source: Bloomberg, Angel Research
Exhibit 2: 2017 GDP Growth projection by IMF (%, yoy) across select developing and developed countries
(%)
6.7
6.8
7.0
6.0
5.4
5.2
5.0
3.7
4.0
3.0
1.8
2.2
2.0
1.7
1.6
2.0
0.7
1.5
0.7
1.0
-
Source: IMF, Angel Research
Exhibit 3: One year forward P-E ratio across select developing and developed countries
(x)
20.0
18.0
16.0
14.0
12.0
10.0
8.0
6.0
4.0
2.0
-
Source: IMF, Angel Research
Market Outlook
February 07, 2018
Exhibit 4: Relative performance of indices across globe
Returns (%)
Country
Name of index
Closing price
1M
3M
1YR
Brazil
Bovespa
83,894
6.7
12.2
30.5
Russia
Micex
2,238
1.8
8.0
1.3
India
Nifty
10,498
(0.1)
0.4
20.2
China
Shanghai Composite
3,371
(0.1)
(0.3)
7.9
South Africa
Top 40
49,856
(5.7)
(6.3)
9.8
Mexico
Mexbol
49,305
(0.9)
1.4
4.4
Indonesia
LQ45
1,090
2.1
10.3
26.7
Malaysia
KLCI
1,812
1.1
3.9
7.6
Thailand
SET 50
1,162
(0.5)
7.6
16.6
USA
Dow Jones
24,913
(0.6)
5.9
24.0
UK
FTSE
7,141
(7.5)
(5.5)
(0.7)
Japan
Nikkei
21,610
(8.1)
(1.8)
13.5
Germany
DAX
12,393
(7.0)
(8.1)
7.3
France
CAC
5,162
(5.6)
(6.5)
6.9
Source: Bloomberg, Angel Research p68in4
Market Outlook
February 07, 2018
Research Team Tel: 022 - 39357800
DISCLAIMER
Angel Broking Private Limited (hereinafter referred to as “Angel”) is a registered Member of National Stock Exchange of India
Limited,Bombay Stock Exchange Limited and Metropolitan Stock Exchange Limited. It is also registered as a Depository Participant with
CDSL and Portfolio Manager with SEBI. It also has registration with AMFI as a Mutual Fund Distributor. Angel Broking Private Limited is a
registered entity with SEBI for Research Analyst in terms of SEBI (Research Analyst) Regulations, 2014 vide registration number
INH000000164. Angel or its associates has not been debarred/ suspended by SEBI or any other regulatory authority for accessing
/dealing in securities Market. Angel or its associates/analyst has not received any compensation / managed or
co-managed public offering of securities of the company covered by Analyst during the past twelve months.
This document is solely for the personal information of the recipient, and must not be singularly used as the basis of any investment
decision. Nothing in this document should be construed as investment or financial advice. Each recipient of this document should make
such investigations as they deem necessary to arrive at an independent evaluation of an investment in the securities of the companies
referred to in this document (including the merits and risks involved), and should consult their own advisors to determine the merits and
risks of such an investment.
Reports based on technical and derivative analysis center on studying charts of a stock's price movement, outstanding positions and
trading volume, as opposed to focusing on a company's fundamentals and, as such, may not match with a report on a company's
fundamentals. Investors are advised to refer the Fundamental and Technical Research Reports available on our website to evaluate the
contrary view, if any.
The information in this document has been printed on the basis of publicly available information, internal data and other reliable
sources believed to be true, but we do not represent that it is accurate or complete and it should not be relied on as such, as this
document is for general guidance only. Angel Broking Pvt. Limited or any of its affiliates/ group companies shall not be in any way
responsible for any loss or damage that may arise to any person from any inadvertent error in the information contained in this report.
Angel Broking Pvt. Limited has not independently verified all the information contained within this document. Accordingly, we cannot
testify, nor make any representation or warranty, express or implied, to the accuracy, contents or data contained within this document.
While Angel Broking Pvt. Limited endeavors to update on a reasonable basis the information discussed in this material, there may be
regulatory, compliance, or other reasons that prevent us from doing so.
This document is being supplied to you solely for your information, and its contents, information or data may not be reproduced,
redistributed or passed on, directly or indirectly.
Neither Angel Broking Pvt. Limited, nor its directors, employees or affiliates shall be liable for any loss or damage that may arise from
or in connection with the use of this information.